Live in the UK and Hong KongUS and UAE in Q1 2027

Assess a development site in under an hour.

PropSmarts pulls planning history, local sales, demographics, feasibility, crime and grid capacity against a single site boundary, so you can shortlist thirty sites in the time it used to take to research three.
app.propsmarts.com/projects/innoex-demo
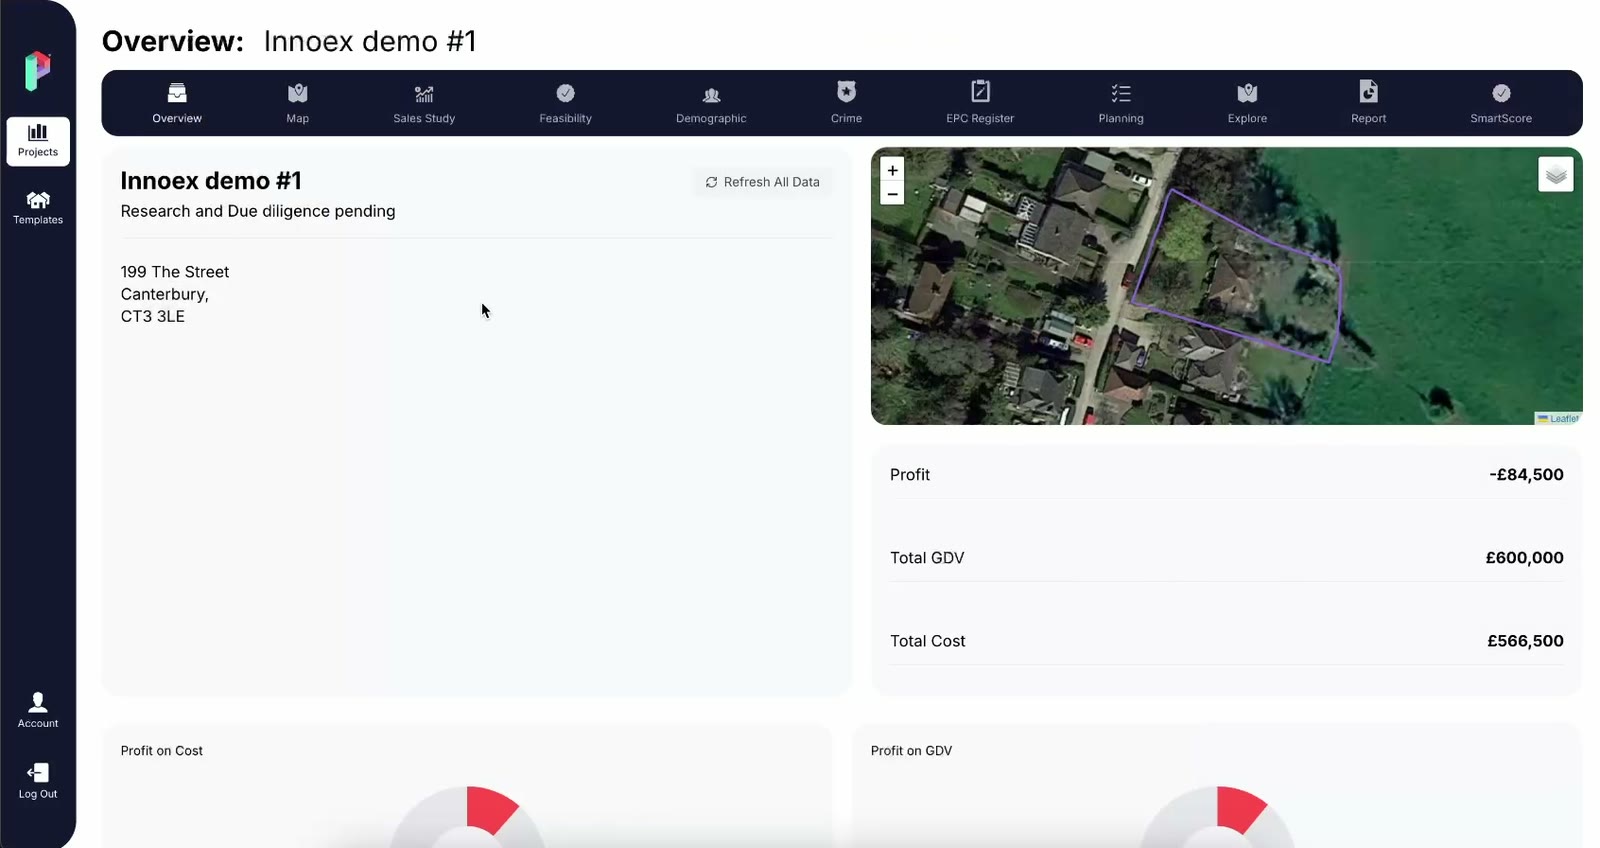
PropSmarts project overview: site boundary on satellite imagery, profit of minus £84,500 against a GDV of £600,000

Two days of desk research, done in under an hour.

Assessing one site properly means planning searches, sold prices, comparables from agents, census tables and an appraisal built by hand. PropSmarts does each of them against the site boundary, in one place.

Planning historyCouncil portal, searched by addressEvery nearby application, mapped
Sales comparablesSold-price searches and agentsRanked by distance, with a predicted value
DemographicsCensus tables by areaProfiled for the site itself
Residual appraisalA spreadsheet built from scratchLive, recalculating as inputs change
Grid capacityAn enquiry to the network operatorSubstations and headroom on the map
Time per siteAround two daysUnder an hour

Every dataset, tied to one site boundary.

The same boundary drives every number, so results stay comparable across a whole shortlist.

Explore the product

Headline scorecard

GDV, cost and profit from the first click

A live scorecard the moment a project is created, updating as you refine the appraisal.

  • Site boundary pulled from the address
  • Profit on cost and on GDV at a glance
  • Stage tags from research to exchange
app.propsmarts.com/projects/innoex-demo/overview
Project overview with site boundary, profit, GDV and total cost

The cost of finding out late

Four months and £35,000 later, you find out what twenty minutes would have told you.

Three common ways a site fails after purchase, and where each one shows up in PropSmarts.

Planning history

Refused twice

Both earlier applications on the site are on the public record, with the reasons for refusal.

Planning history

A neighbour lost a storey on daylight

A decided scheme next door sets the local precedent for height before you draw anything.

Feasibility

Affordable housing kicks in one unit below your scheme

The policy threshold changes the appraisal, and the appraisal shows it on day one.

Built for developers, lenders and investors.

Each team reads the same site data for a different decision.

Developers

Find the good site faster.

  • A live pipeline sorted by deal stage
  • Comparables you can put straight into an appraisal
  • What actually gets through committee locally
For developers

Lenders

Underwrite with evidence.

  • Filter a loan book by planning risk
  • Stress test a borrower's appraisal in seconds
  • Grid constraint flagged before drawdown
For lenders

Investors

Compare every site the same way.

  • One dashboard across a portfolio
  • Rank a shortlist like for like
  • Investment committee papers from live data
For investors

Product walkthrough

One real site, from address to risk score.

A narrated seven-minute run through a site in Canterbury, with a chapter for each module.

Live in the UK and Hong Kong. The US and UAE follow in Q1 2027.

The same workflow in every market, built on local data.

World map marking the UK and Hong Kong as live, and the US and UAE as launching in Q1 2027
LIVEUnited KingdomAvailable now
LIVEHong KongAvailable now
Q1 2027United StatesRegister interest
Q1 2027United Arab EmiratesRegister interest

Bring a site you're looking at. We'll run it live.

Demos take twenty minutes, and there's a free six-day trial afterwards.